

- 5.19 MB
- 2021-03-02 发布


- 1、本文档由用户上传,淘文库整理发布,可阅读全部内容。
- 2、本文档内容版权归属内容提供方,所产生的收益全部归内容提供方所有。如果您对本文有版权争议,请立即联系网站客服。
- 3、本文档由用户上传,本站不保证质量和数量令人满意,可能有诸多瑕疵,付费之前,请仔细阅读内容确认后进行付费下载。
- 网站客服QQ:403074932
Remote Sensing
Last Lecture
Absorption features
Vegetation
Soils
Rocks and minerals
Water, ice and snow
Conclusions
Last Lecture
EMR which has interacted with matter will be deficient in some wavelengths, due to absorption processes occurring at atomic or molecular scales
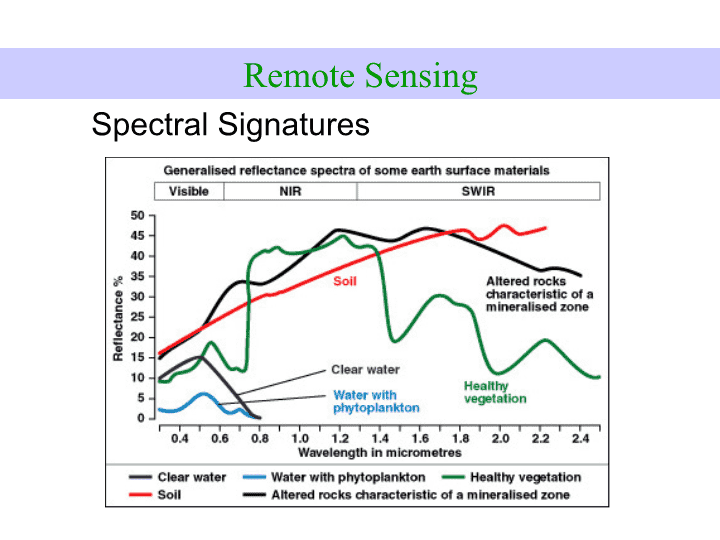
These absorption features create distinctive “spectral signatures” for different Earth surface types
These can be exploited by “multispectral” remote sensing methods for mapping and monitoring purposes
Remote Sensing
Spectral Signatures
Remote Sensing
Remote Sensing
地表任一点反射的电磁波被分解为若干个波段,每个波段有一个反射率
Remote Sensing
反射率的大小用灰度表示,并被转换成数字信号,通常是
2
8
(
0-255
)
50
40
30
20
10
0
0.4
0.6
0.7
0.8
1.3
R
E
F
L
E
C
T
A
N
C
E
(%)
Wavelength (micrometers)
Visible
0.5
Near IR
Grass
GREEN
BLUE
GREEN
RED
BLUE
GREEN
RED
NEAR IR
Near IR
Band Placement
Band Display
Band 1
Band 2
Band 3
Band 4
Band 5
Band 7
BLUE
GREEN
RED
NEAR IR
SHORT
WAVE IR
MID-
WAVE IR
NEAR IR
Color Theory
All colors created from additive primary colors:
Red
Green
Blue
Complementary colors:
Magenta
Yellow
Cyan
Red
Green
Blue
M
C
Y
W
Black
Multispectral Display
BLUE
GREEN
RED
NEAR IR
SHORT
WAVE IR
MID-
WAVE IR
LONGWAVE IR
1
Landsat TM Band
2
3
4
5
7
6
Band Combination =
7
4
2 (LANDSAT)
Color Guns =
Band Composite Output =
Band 3
Visible Red
Band 2
Visible Green
Band 1
Visible Blue
Individual Landsat Bands
Applied to Color Guns
Resulting Image
Band 4
Near Infrared
Band 3
Visible Red
Band 2
Visible Green
Individual Landsat Bands
Applied to Color Guns
Resulting Image
AVRIS Hyperspectral Cube
Airborne Visible/Infrared
Imaging Spectrometer
224 spectral channels
400 – 2500 nm spectral resolution,
20 meter ground resolution.
Brine Shrimp pond
Sensing
Sensor array
Lens
225
214
199
198
202
176
Each “cell” recorded as a “digital number” (DN) or “brightness value”
Measures amount of EM radiation
The brighter the signal, the higher the value.
Pixels
Each cell is called a
“
picture element
”
, or pixel
Each pixel represents a single brightness value for a specific geographical area
225
204 188 146
214
198 169 152
202
200
178 162
i columns
j rows
i
x
j = 4
x
4 = 16 pixels
114
109
101
97
Sensor Properties
Spatial resolution
Spectral resolution/# bands
Radiometric resolution
Temporal resolution
Source: NASA
Spatial Resolution
Measure of the smallest angular or linear separation between 2 objects that can be resolved by the sensor
In practice, sensor system
’
s
nominal spatial resolution
is the dimension in meters (or feet) on the ground projected instantaneous field of view (IFOV)
Generally, smaller spatial resolution
greater the resolving power of the sensor system
Spatial Resolution
IKONOS
4m
Landsat
30m
DOQ
0.5m
© Space Imaging
(cont.)
Spatial Resolution
Useful rule
: T
o detect a feature, the spatial resolution of the sensor system should be less than
½
the size of the feature measured in its smallest dimension.
Spectral Resolution
Number and size of the bands which can be recorded by the sensor
–
nominal spectral resolution
Coarse
–
sensitive to large portion of ems contained in a small number of wide bands
Fine
–
sensitive to same portion of ems but have many small bands
Goal
–
finer spectral sampling to distinguish between scene objects and features
More detailed information about how individual features reflect or emit em energy increase probability of finding unique characteristics that enable a feature to be distinguished from other features.
Spectral Resolution
the SPECTRAL resolution defines the range of light stored in the image
A black and white photograph stores a visible light; it has one channel that stores the light for 0.4 to 0.7 micrometers
A natural color image stores reflected red, blue and green light in different channels; e.g. 0.45 - 0.52
m
m for blue, 0.52 - 0.60
m
m for green and 0.63 - 0.69
m
m for red
A LANDSAT image contains 7 channnels as described above that store reflected light other than visible light.
A HYPER-SPECTRAL image contains hundreds of channels. E.g. A hyperspectral image that collects visible light may divide the visible light range into 300 channels, each channel containing a narrow range of wavelengths.
Spectral Resolution/# Bands
100s of Bands
Hyper-spectral
NIR
SWIR
LW IR
SWIR
Band
2
.53-.62
Band
3
.63-.69
Band
1
.45-.52
Visible
Band
4
.79-.90
Band
5
1.55-1.75
Band
7
2.08-2.35
Band
6
10.4-12.4
Near IR
SWIR
LWIR
1000s of Bands
Ultra-
spectral
Multi-
spectral
Spectral Resolution/# Bands
Radiometric Resolution
the RADIOMETRIC resolution defines the range of values that an individual pixel can have
Refers to the sensitivity of the sensor to incoming radiance.
Typical digital images have a range of values from 0
–
255 (a total of 256 possible values).
An image that just has black or white pixels would only store 0 (black) or 1 (white).
RADAR images have range from 0 to 4.3 x 10
9
.
Radiometric Resolution
Temporal Resolution
How often the remote sensing system records imagery of a particular area.
Examples
–
Landsat 18 days
SPOT 26 days
Temporal Resolution
2752 Km at
the Equator
185 Km
Orbit 1, Day 1
Orbit 2, Day 1
Orbit 1, Day 8
Orbit 2, Day 8
Landsat
Trade-Offs
Aerial Photo
IKONOS
Landsat
Spatial Resolution
½
m
4m
30m
# Bands
1
4
7
Radiometric Resolution
8 bit
11 bit
8 bit
Temporal Resolution
On demand
3-4 days
16 days
© Space Imaging
Spatial and temporal
requirements for remote
sensing applications in
agriculture.
Resolution requirements for different applications
Summary of Resolution
By increasing 1 or any combination of these resolutions, increase chance of obtaining remotely sensed data about a target that contains accurate, realistic, and useful information.
Downside of increased resolution
need for increased storage space, more powerful processing tools, more highly trained individuals.
The End
Source: Space Imaging